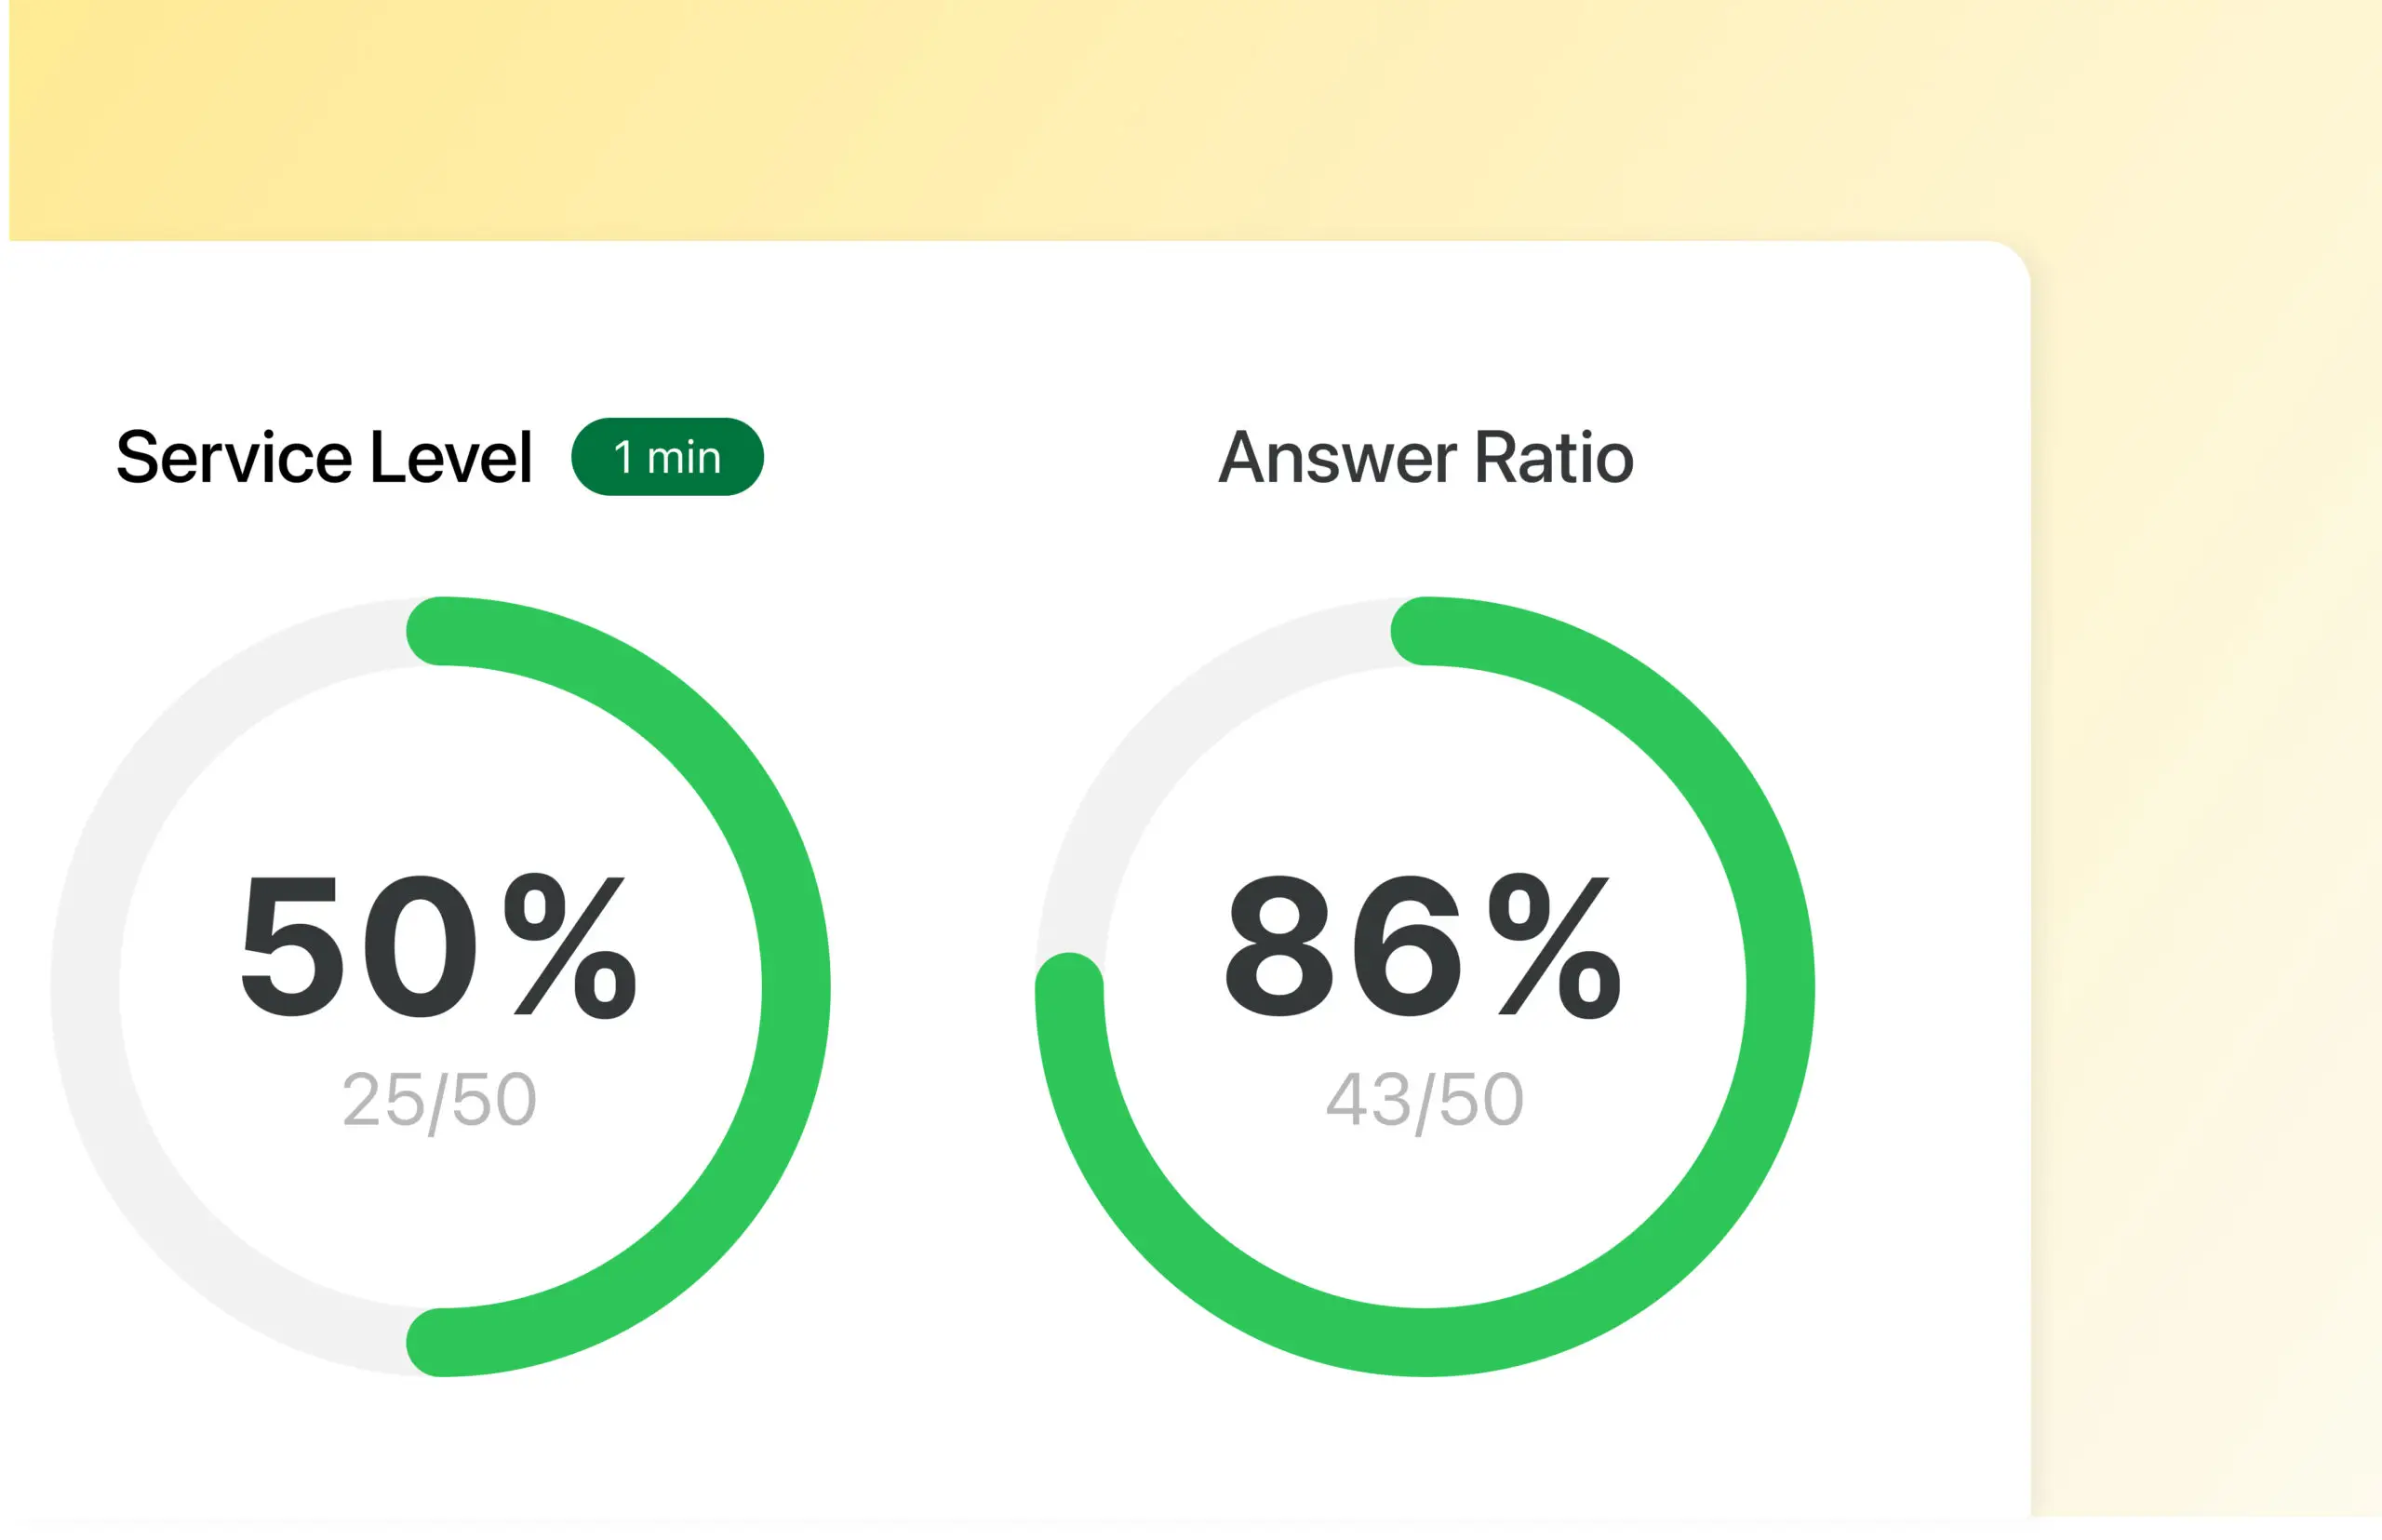
Our switchboard gives you a clear picture of how your internal communication is working and how customers who contact you are treated. For example, you can see how long your call queues are, how many calls are answered, and average call duration. Review statistics by day, week or month, monitor them in real time, or request standing reports. If you use Microsoft’s Power BI, you can easily generate graphs and information there, otherwise you download the statistics as raw data for your own reports and tools.