
How do you use the statistics from your company’s switchboard? Do you just look at how you can answer faster and reduce call duration? Or are you thinking about what actually matters most to the customer? Elin Thiman, Customer Success Manager at Telavox, explains how to use the statistics from the switchboard in the best way.
Many companies put energy into reducing the waiting time on the phone from, for example, 1.5 minutes to 1 minute and 10 seconds, but this does not necessarily make the customer happier.
“Always start by digging deeper into what people expect and need from your business. Is it that customer service responds within 5 seconds – or that you can be reached after 7pm?”, says Elin Thiman.

Better service with statistics from your exchange
Elin talks about how important it is to use the insights from the shift statistics in scheduling.
“Are there huge phone queues in the afternoon, while the team is twiddling their thumbs at lunchtime? Then you may need to staff differently to maintain a consistent and high level of service,” she notes.
Something that can bring great added value to both employees and customers is something as basic as adjusted opening hours.
“By having customer service open from, say, 8am to 6pm instead of 9am to 5pm, you spread the phone calls and the workload over the day, and can also give your employees more flexible working hours,” says Elin.
Based on the statistics, you can create much better conditions both internally and towards the customer.
“It’s when you start using insights, instead of just going on instincts, that it will really pay off,” says Elin.
Rallying around shared achievements
Another important factor when it comes to statistics and gearing is to focus on the team instead of comparing at the individual level.
Working towards a common goal is often more motivating for a customer service team than pitting the performance of different employees against each other.
“Before you decide to throw up top lists on TV screens around the office, you should look at the statistics as a basis for discussion. Why do some calls average 3 minutes and others 45 seconds – even though they are about the same thing?” says Elin.

Shorter conversations are not necessarily better, sometimes the opposite is true. Longer calls can mean more sales and relationship building.
“The important thing is to discuss why the statistics look the way they do and anchor the purpose of presenting the results live. This makes it more fun for employees to work towards common goals. And then it matters less that Jonas has “only” had 3 conversations in the same time as Jenny has had 10″, Elin concludes.
How is your telephone exchange?
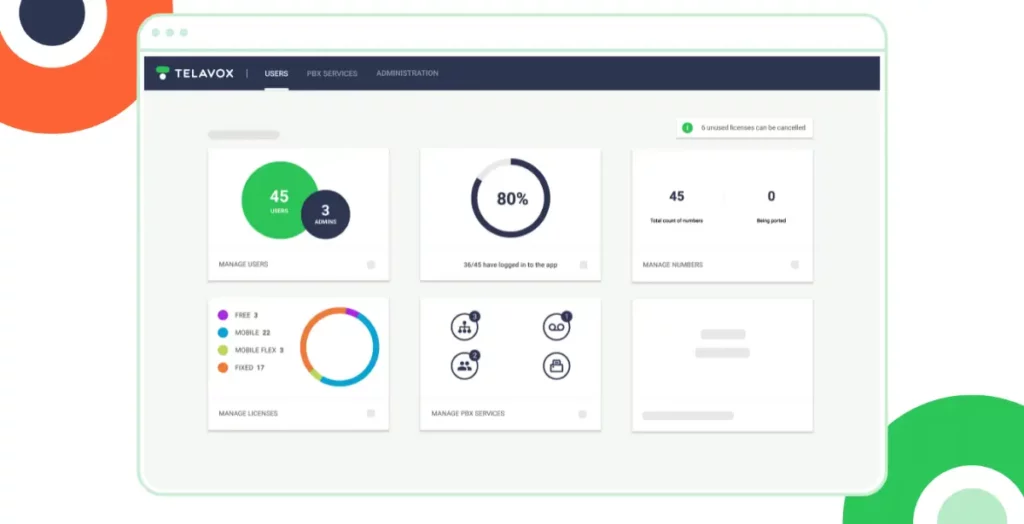
Don’t have statistics to show how your company’s switchboard is doing? Get Telavox. Telavox statistics give you an important overview: How much data are you using? How many calls are made, and at what time?
Call statistics can help you streamline your operations and make big savings. When are your phones ringing the most, and when is your customer service too busy? Take a look at your statistics in our admin portal (and maybe integrate with PowerBI for extra data) and improve your customer service!
Book a free demo and discover how fun and easy it can be to manage your exchange statistics.