

Gain clear insight into how your company’s telephony is used. With call statistics in Telavox, you can monitor how calls are handled over time, how customers are received, and how phone queues develop – all in one place in Telavox.
How Call statistics works
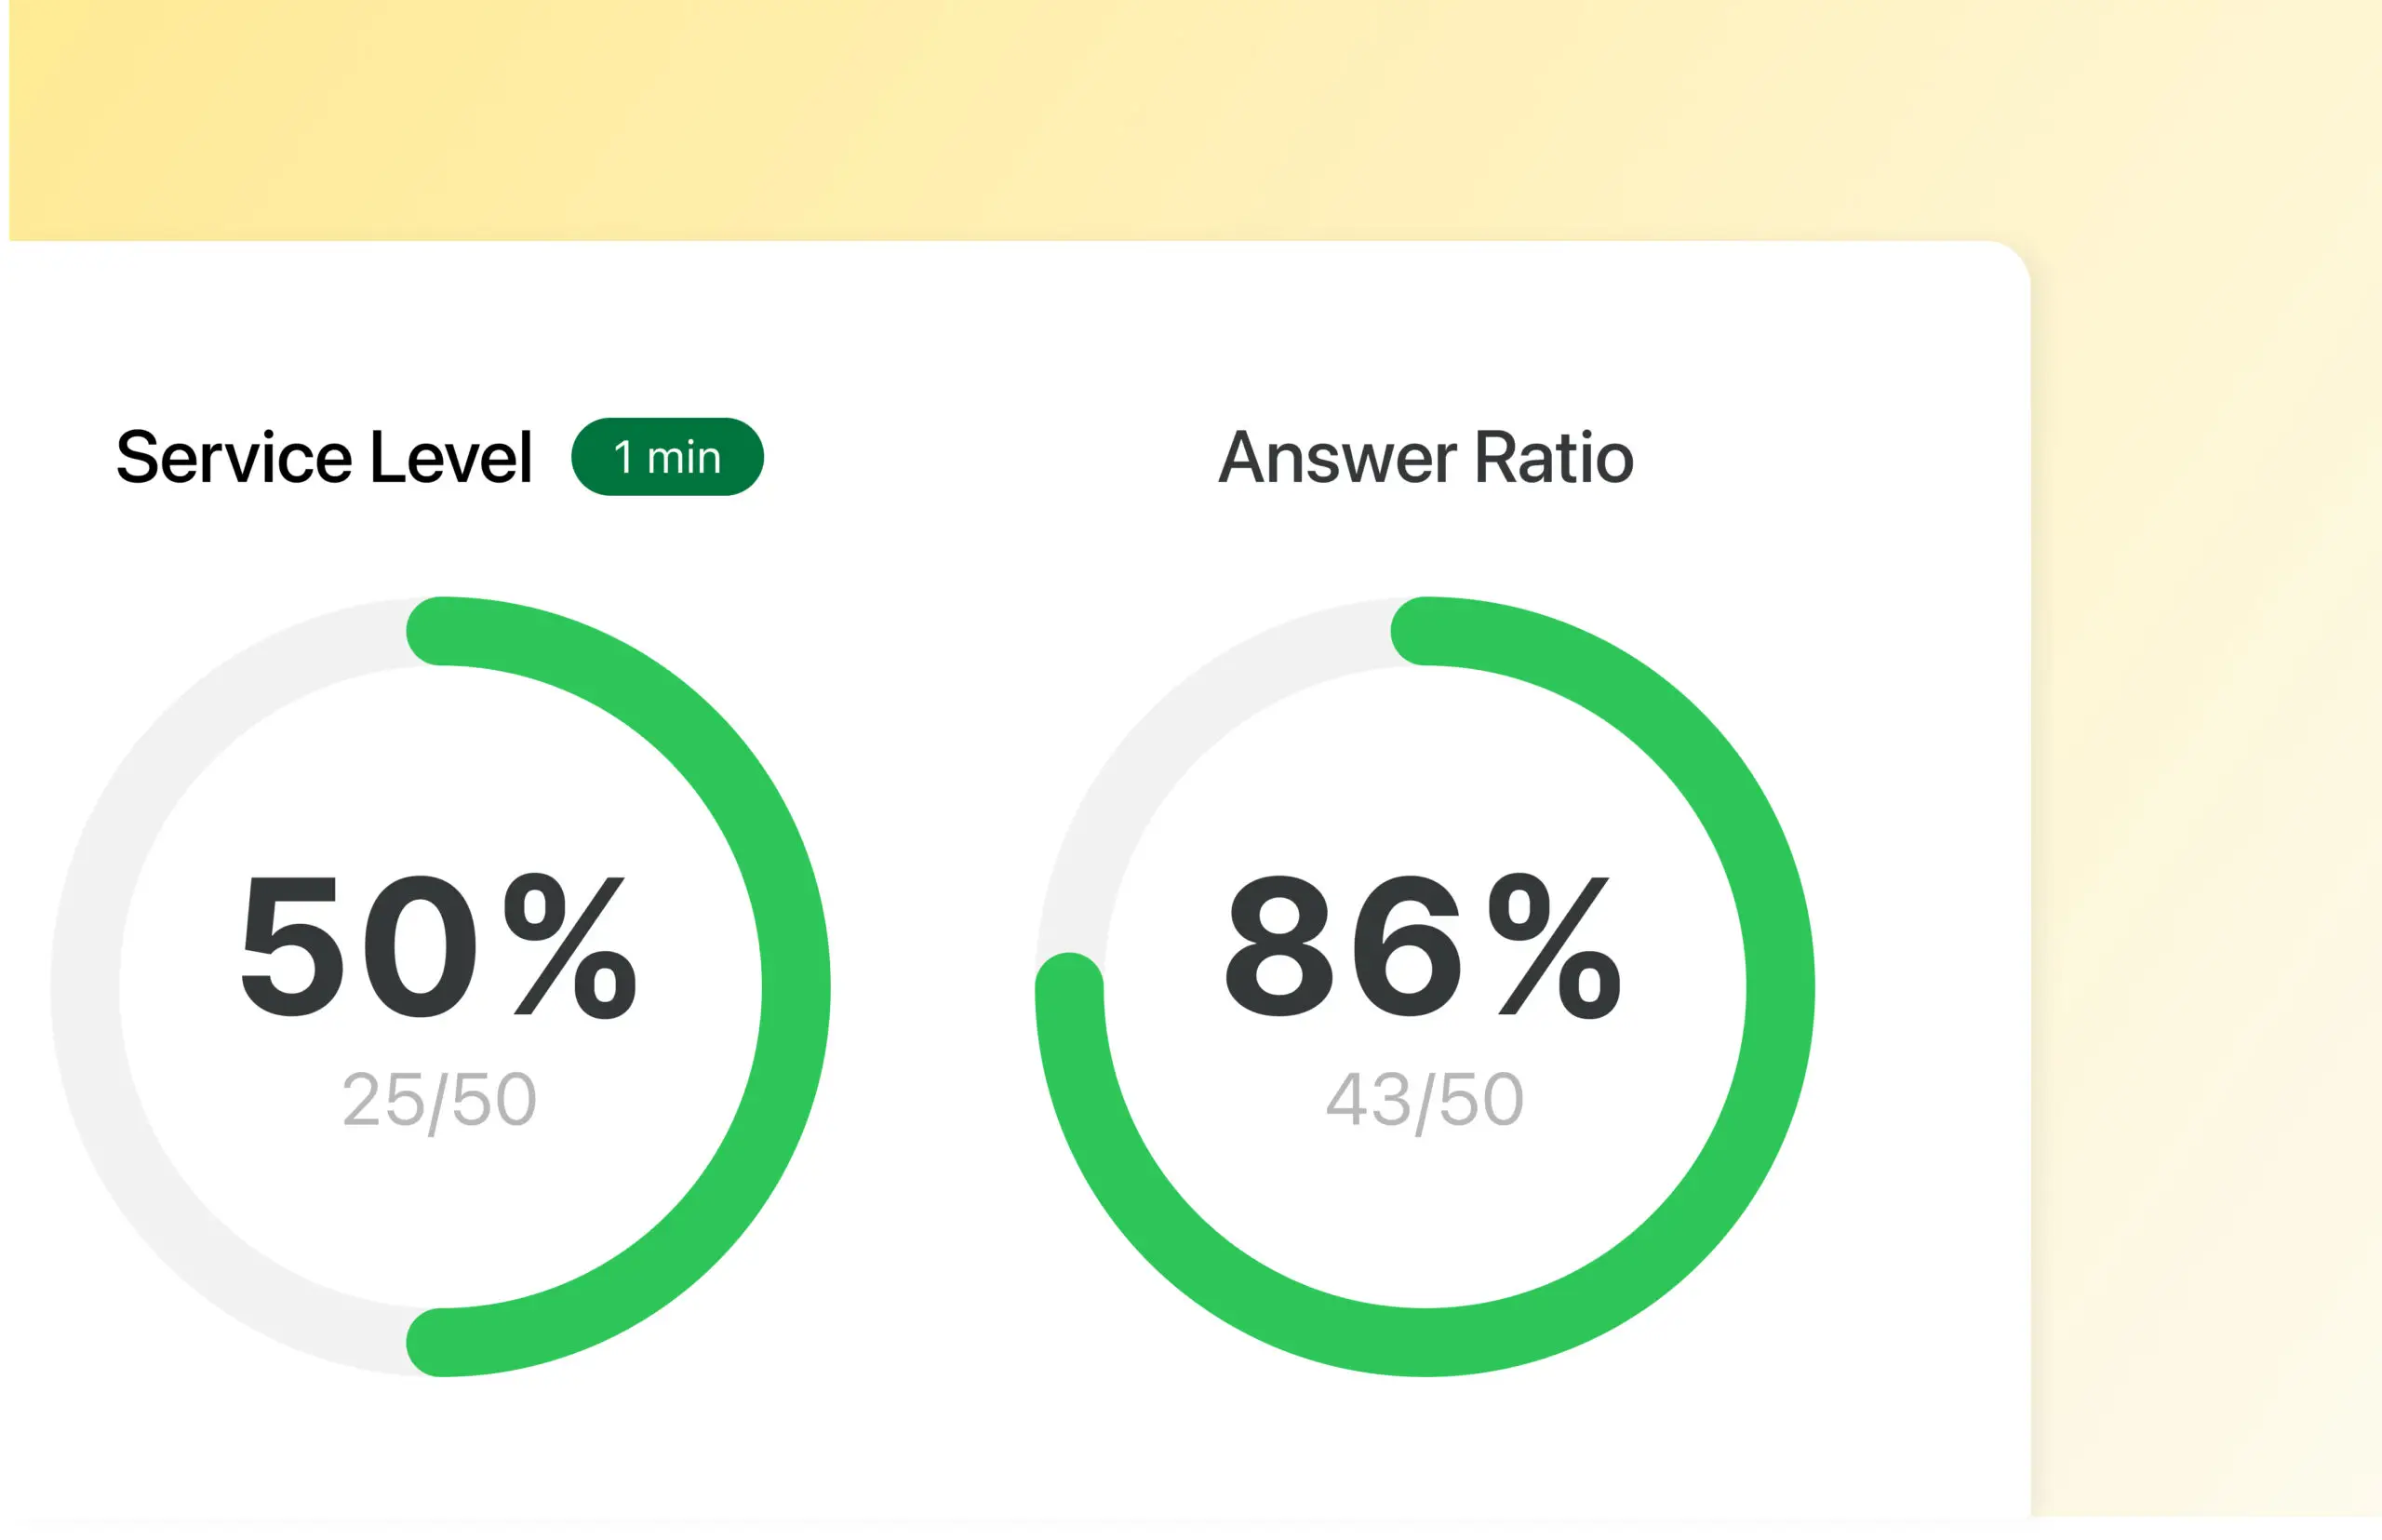
Call statistics can be monitored in real time or viewed by day, week, and month. See response rates, queue lengths, number of answered calls, and average call duration, or easily create and schedule reports via the admin portal.
For businesses working with external analysis tools, the statistics can also be used alongside Telavox integrations for further analysis and follow-up.
Get started
Want to get even more out of your call statistics? With Telavox Studio, you get access to ready-made views and reports directly in the tool. For more advanced needs, there is also the Telavox Studio API, which makes it possible to stream raw data to the company’s own analysis tools.
Contact Telavox sales and we will help you further.


